Every quarter private equity data provider Pitchbook releases their accounting of the private equity benchmarks. Here’s a look.
Private Capital Horizon IRRs
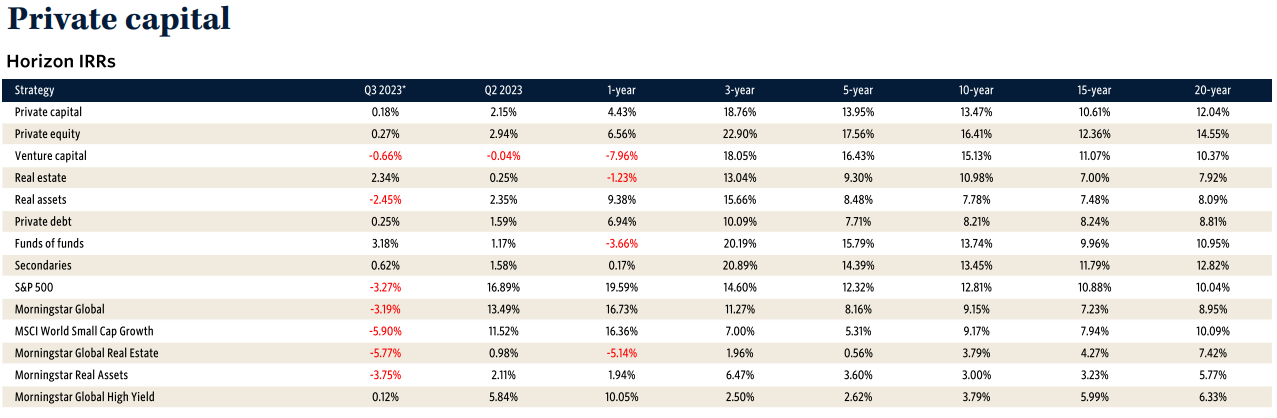
The first look is of private capital horizon internal rates of return (IRRs). The first column from the left is the horizon IRRs for the third quarter of 2023. On top of the list is Fund of funds at 3.18%. Surprising? Second and third place performance belong to Real estate at 2.34% and Secondaries at 0.62%.
On the other end, the weakest performing strategies were MSCI World Small Cap Growth at -5.90%, followed by Morningstar Global Real Estate at -5.77% and Morningstar Real Assets at 3.75%. Interesting, very interesting.
Of course, if one shifts the horizon view from the third quarter of 2023 to say the 20-year horizon, the rankings are completely different. On top of the 20-year horizon IRR list are Private equity at 14.55%, followed by Secondaries at 12.82% and Private capital at 12.04%.
The bottom three over a 20-year horizon includes Morningstar Real Assets at 5.77%, Morningstar Global High Yield at 6.33%, and Morningstar Global Real Estate at 7.42%.
Annual Horizon IRRs
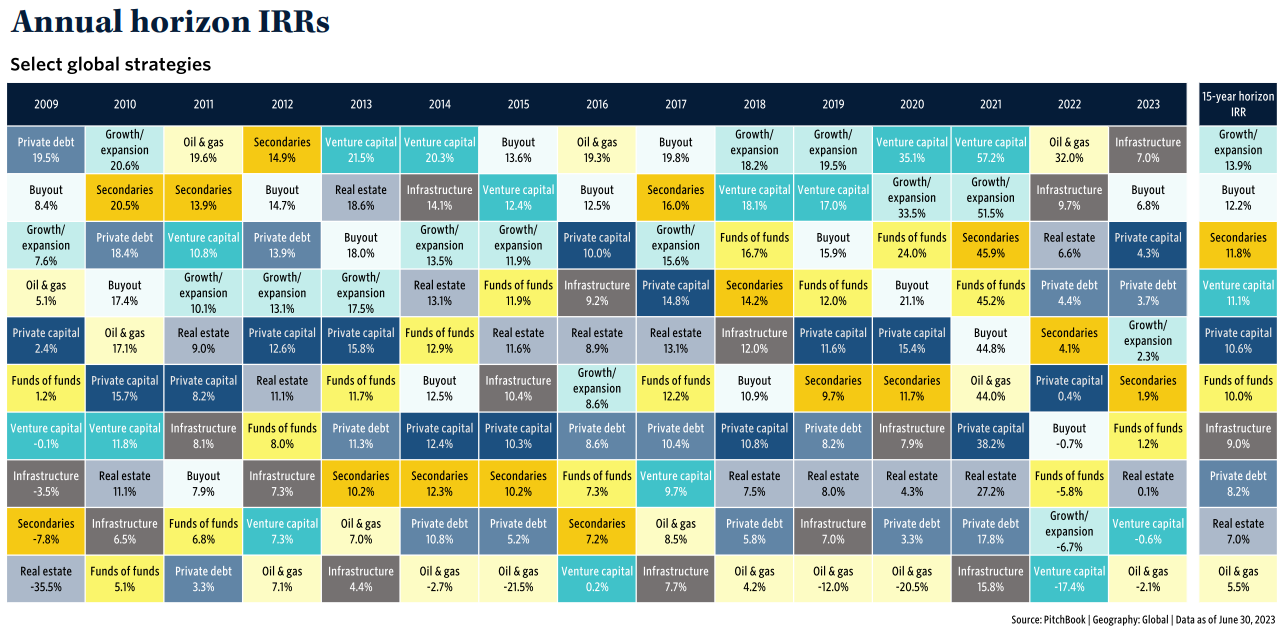
Shifting to the second view of the market, the follow tree plot is the annual horizon IRRs by selected global strategies. For 2023, the top strategy was, perhaps unsurprisingly, Infrastructure at 7.0%, followed by Buyout at 6.8% and Private capital at 4.3%.
On the other end of the spectrum, the weakest strategy returns were for Oil & gas at -2.1%, Venture capital at -0.6%, and Real estate at 0.1%.
The Private Equity Multiples View
The third fascinating view provided by Pitchbook is their accounting of private equity multiples by vintage. Overall, multiples have been weaker in recent years, as one would generally expect given the shorter nature of the investment horizon. Interestingly, among pooled multiples, the TVPI dropped to a low of 0.99x, the DPI dropped to 0.03x, and the RVPI dropped to 0.96x. On the equal-weighted pooled multiples, the TVPI declined to 1.14x, the DPI declined to 0.06x, and the RVPI held steady at 1.08x.
Looking backwards, according to Pitchbook’s accounting, the best year for private equity investing was 2011, with local highs in many of the reported measures. This is unsurprising given that the global economy was on its way out from the effects of the global financial recession of 2009 and 2010.
Summing Up
Overall, private equity conditions vary widely by strategy and chosen evaluation horizon. Acknowledging such, the coming years for private equity investors should be quite interesting. Investors that choose their strategy wisely could be healthily rewarded.

Comments on this entry are closed.