From the category archives:

PE & VC News

On Friday, the U.S. Bureau of Labor Statistics (BLS) released their monthly jobs report. As has been widely reported, the net new jobs created blew through expectations at 303,000 net new jobs in March. The better-than-expected jobs number begs the question – How healthy is the American labor market? Here are five charts to address that question.

The Broad Picture

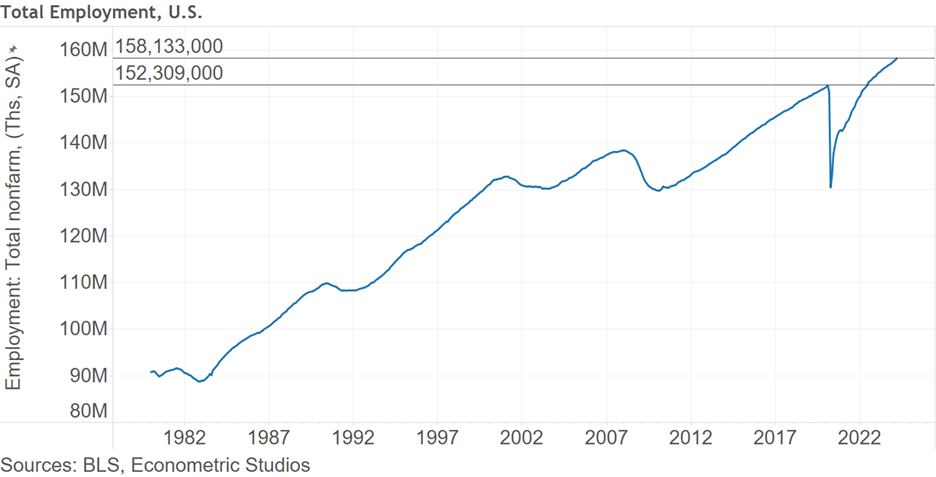
First, the broad picture. There are 158,133,000 employed individuals in the United States (seasonally adjusted). This is up from the pre-pandemic February 2020 count of 152,309,000. Although there are problems with the American labor picture, it could be much worse.

The Labor Force Participation Picture

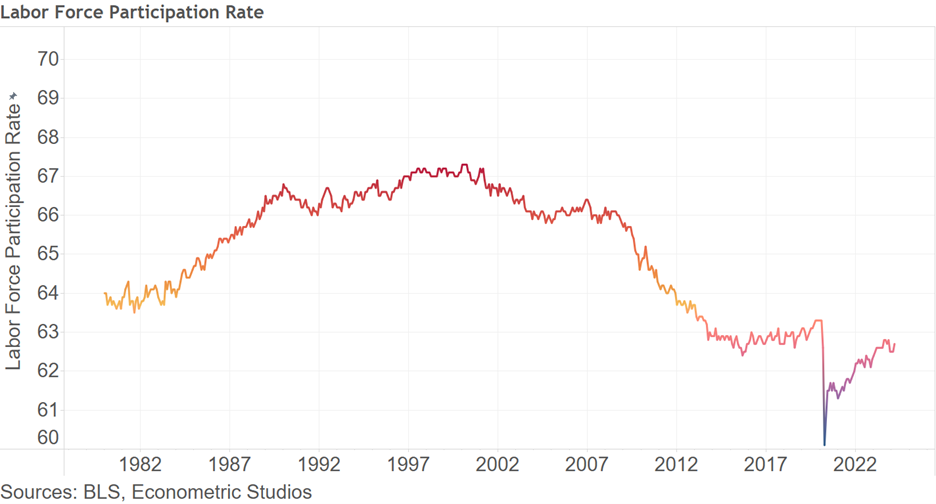
Another gauge of American labor picture is labor force participation. At 62.7%, the working age population is still behind where labor force participation stood in February 2020 at 63.3%. On the one hand, this suggests there’s room for further employment expansion, while on the other hand it perhaps suggests that fewer Americans want to work the jobs that await them in the labor market.

The Full-time and Part-time Employment Picture

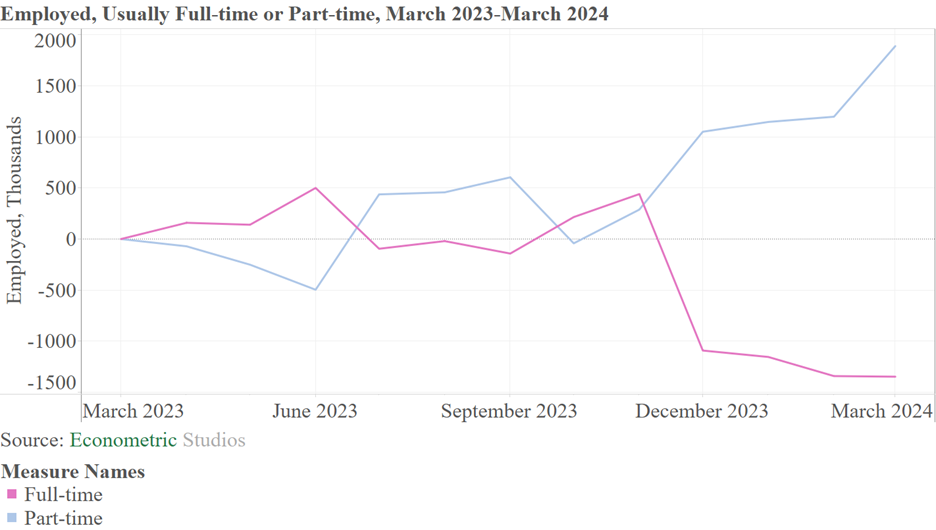
A third view of the American labor picture is the reporting of individuals saying they usually work full-time and those that report usually working part-time. According to the Household Survey (a survey by the BLS of a sample of U.S. households), since 2023, the number of individuals reporting they usually work full-time is down 1.347 million. By contrast, the number of individuals reporting usually working part-time is up 1.888 million. The drop in full-time employment began in December 2023, at the same time that part-time work started rising quickly. All being said, this does not necessarily suggest a downturn in economic conditions is imminent, but it does suggest caution.

The Wage Picture

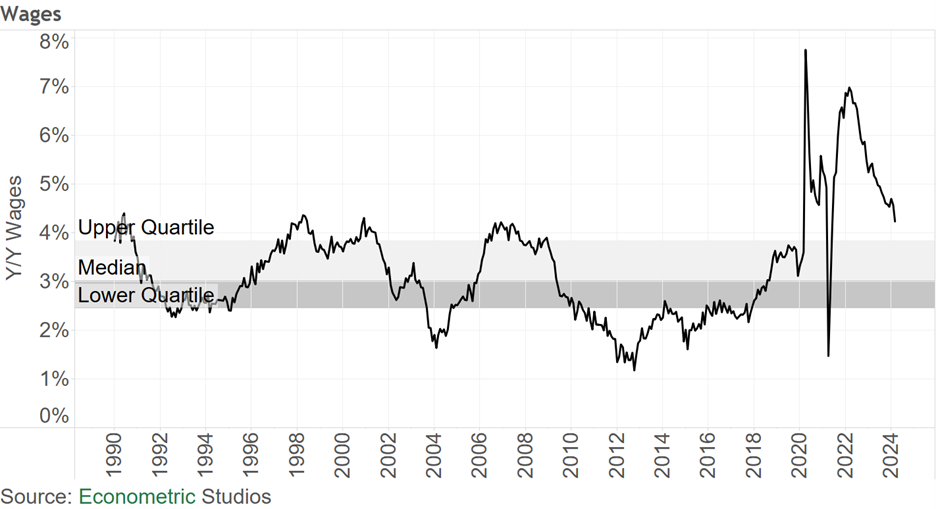
The fourth chart is the wage picture. Year-over-year growth in wages stood at 4% in March, down from the March 2022 peak of 7%. Although wages are trending down, growth in wages at 4% is still well above what would be comfortable for Federal Reserve policymakers, whose job it is to bring inflation down to 2% (preferably 0). The wage picture suggests there’s still a long way to go.

The Unemployment Picture

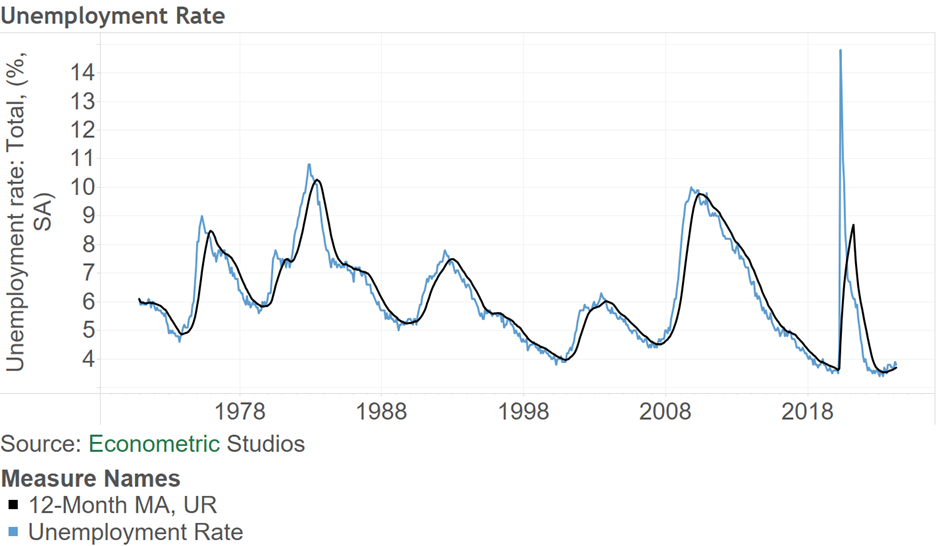
The fifth view is the unemployment picture. Shown in the figure below is the BLS’ reported unemployment rate with its 12-month moving average. Overall, the U.S. unemployment rate dropped from 3.9% in February to 3.8% in March. Of a bit of concern, the unemployment rate has been floating above its 12-month moving average for almost a year now (since May 2023). Typically, when the actual unemployment rate floats above its 12-month moving average, the U.S. is either in a recession or is on the cusp of entering one. This measure is worth watching.

Summing Up

Overall, the American employment picture is relatively healthy, with employment at an all-time high even though full-time employment has been trickling down over the past year. To some, the jobs picture may look like we’re at peak employment, whereas to others the employment market is hitting a healthy cruising speed. The coming months will give us more tell on what the true story is.

{ 0 comments }
In recent years, investors have taken a shine to private debt. Given the increased interest, here’s a review according to a recent report out of private equity data provider Pitchbook.

The Broader Picture

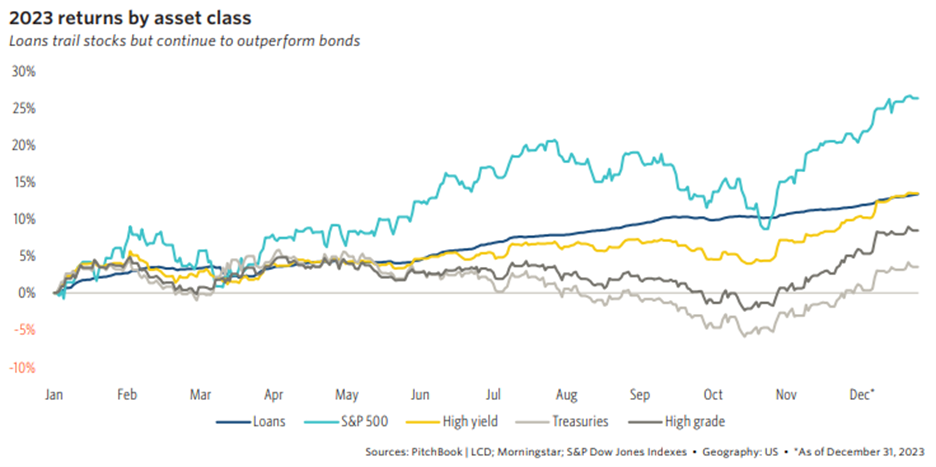
The first view is the broader picture of returns for 2023. Loans, as measured by Morningstar’s LSTA Index, performed well, up 13% for 2023. This was in line with the returns of High yield bonds, and much stronger than the returns of Treasuries and High grade.

Where is the fundraising coming from?

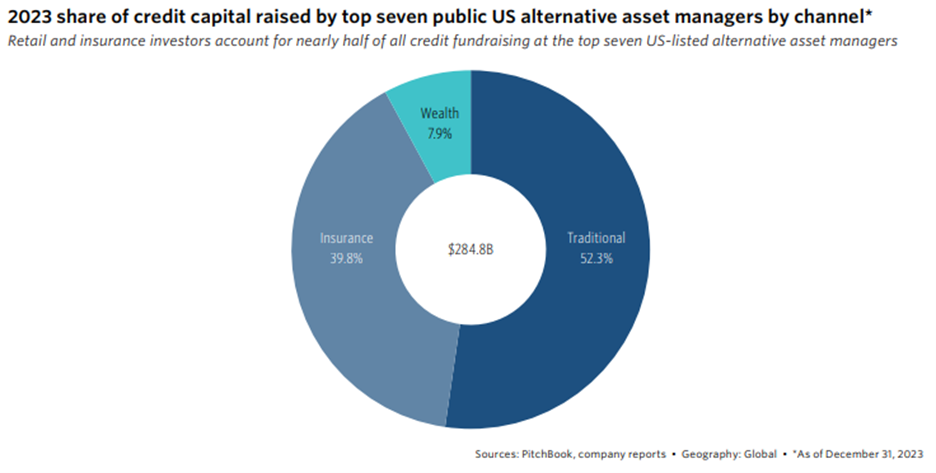
Which entities are investing in private credit fundraising? Interestingly, the top source of funds in 2023 was Traditional at 52%, implying that almost half of all fundraising was from non-Traditional source. Leading out of the non-Traditional providers was Insurance at almost 40%, followed by Wealth at about 8%.

More private credit IPOs than private equity IPOs?

Perhaps one of the more fascinating findings from the Pitchbook report is that there have been more private credit IPOs than there have been private equity IPOs. Simply amazing, and maybe not a good trend. In any event, the next table has four private credit IPOs of 2024. On top is Blue Owl Capital Corporation III at $1.9 billion, followed by Nuveen Churchill Direct Lending at $1.0 billion, Morgan Stanley Direct Lending at $1.8 billion, and Palmer Square Capital BDC at $536 million.

How are private credit fundraising and dry powder looking?

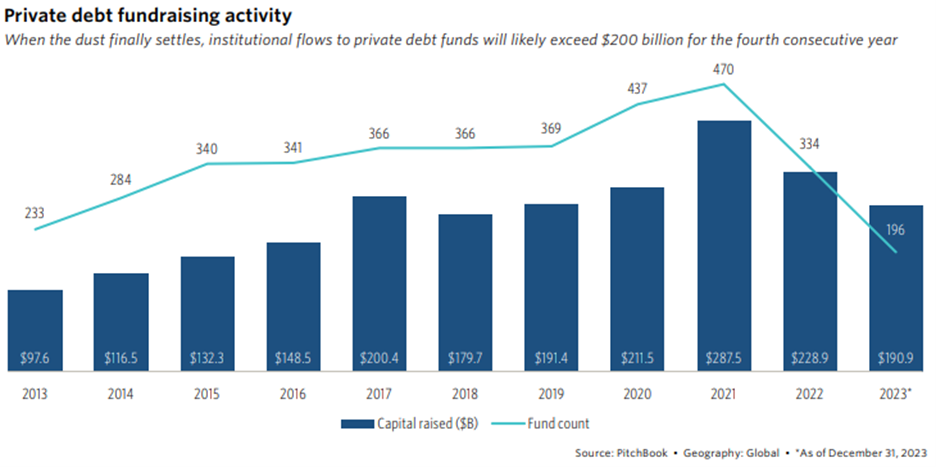
The next view is of private credit fundraising and dry powder. For the fourth consecutive year, private debt funds will likely exceed $200 billion for the fourth consecutive year. The first year private credit exceeded $200 billion was in the pandemic-cash era of 2020 at $212 billion. Fundraising reached its all-time high of $288 billion in 2021, then dropping to $229 billion in 2022 and $191 billion in 2023.

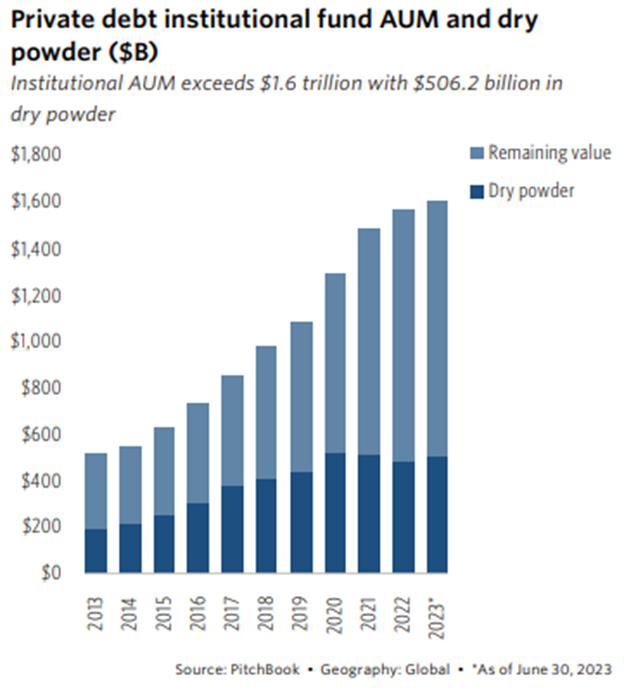
Switching to the dry powder view, the next figure has an accounting of the dry powder picture. Amazingly, dry powder is almost a third of all assets under management of $506 billion ($1.6 trillion in assets under management).

Summing Up

Overall, 2023 was a good year for private credit. Given that interest rates are likely to change in 2024 and 2025, it will be worth watching to see what happens with interest in private credit funds over the coming two years. Will private credit be able to continue to provide a good return to investors with lower interest rates? Perhaps – and it depends on how investors view risk and the potential return of competing asset classes in relation to private credit.

{ 0 comments }

Every now and then private equity data provider Pitchbook releases a new report that catches the eye. This past week, Pitchbook released their take on the top 20 initial public offering (IPO) candidates for 2024. The results are based upon Pitchbook’s proprietary ranking algorithm. Here’s a look, but before you look, take a guess. Do you think you can guess any of the top 20?

Some Background First

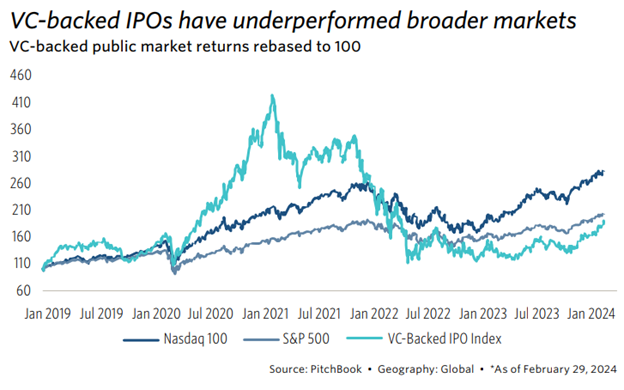
Before getting into “the list,” the following two figures provide some backdrop on the state of venture capital-backed companies. The first figure below shows the performance of VC-backed IPOs against the broader markets. Overall, based upon Pitchbook’s VC-Backed IPO Index, VC-backed companies have generally underperformed the broader markets, with the broader markets being represented by the Nasdaq 100 and the S&P 500. The difference has been stark against the Nasdaq 100, with the Nasdaq 100 up by more than double the VC-Backed IPO Index. Comparing the VC-Backed IPO Index against the S&P 500 is more even, with the VC-Backed IPO Index only slightly below the S&P 500. And, if one were to take out the Magnificent 7 from the return of the broader markets, the VC-Backed IPO Index looks much better.

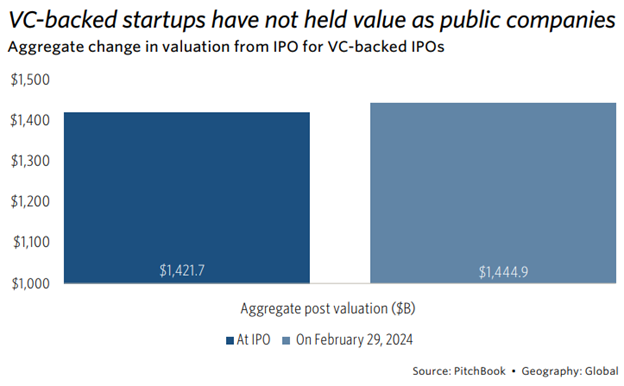
The second figure, shown below, is the value of VC-backed startups relative to when they went public. As shown, VC-backed startups have not held their value as public companies, a troubling concern for VC investors.

The Top 10 List

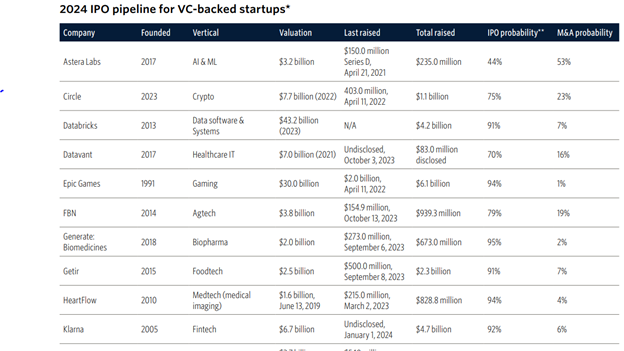
Given the aforementioned background, the following figure has the top 10 IPO targets for the 2024 VC-backed companies. Interestingly, in the top spot is Astera Labs. Founded in 2017, the artificial intelligence and machine learning startup has a value of $3.2 billion and, according to Pitchbook’s take, has a 44% chance of doing an IPO in 2024. Perhaps even more interestingly, Astera Labs has a 53% chance of being targeted by an M&A (mergers and acquisition) transaction.

In second place is crypto firm Circle. The privacy company has a 2022 value of $7.7 billion with $403 million last raised in April 2022. According to Pitchbook, the company has a 75% chance of doing an IPO in 2024 and a 23% chance of being targeted by an M&A.

In third place is data and software systems provider Databricks. The company has a pre-IPO valuation of $43 billion and has raised $4.2 billion over its life. According to Pitchbook, Databricks has a whopping 91% chance of going through an IPO in 2024, much higher than the 9% probability of being the target of an M&A transaction.

Rounding out the top five are Datavant and Epic Games. According to Pitchbook, Datavant has a 70% chance of going public in 2024 whereas Epic Games has a 94% chance.

Summing Up

Overall, Pitchbook’s 2024 outlook for the top IPO candidates provides a fascinating look at what may be on tap for the rest of the year.

{ 0 comments }

Looking at the Success of First Venture Capital Managers

February 27, 2024

Venture capital (VC) has long been regarded as a high-risk, high-reward domain dominated by seasoned investors and industry veterans. However, in recent years, a noteworthy trend has emerged – the startup of first-time venture capital managers. These ambitious individuals, often armed with a unique perspective and fresh ideas, have been making waves in the traditionally […]

Read the full article →

Valuations and Deal Size Keep Dropping

February 13, 2024

In recent years, the private equity (PE) and venture capital (VC) markets have held up relatively well. When interest rates began to rise in March 2022, some observers suggested that the PE and VC markets were in for a world of hurt. Although cracks have appeared through the past three years, the cracks have been […]

Read the full article →

Fintech Activity is Slowing Quickly

January 30, 2024

In 2023, fintech venture capital (VC) came in at $34.6 billion. According to venture capital and private equity data provider Pitchbook, that represented a year-over-year decline of 43.8%. Interestingly given the common view that fintech his generally focused on the consumer, about 72% of the total fintech VC dollars went to business-to-business applications, a sharp […]

Read the full article →

Looking at the Updated Performance Benchmarks

January 16, 2024

Every quarter private equity data provider Pitchbook releases their accounting of the private equity benchmarks. Here’s a look. Private Capital Horizon IRRs The first look is of private capital horizon internal rates of return (IRRs). The first column from the left is the horizon IRRs for the third quarter of 2023. On top of the […]

Read the full article →

Looking at Europe’s Top 10 Venture Deals in 2023

January 2, 2024

Private equity data provider Pitchbook recently released their take on the top 10 venture deals of 2023 for Europe. The fascinating look is worth a read. Number 10 Coming in at number 10 is Butternut Box. The London-based dog food company raised a whopping £280 million in October, valuing the company at over £500 million. […]

Read the full article →

Venture Capital Outlook 2024: Navigating an Odd Landscape

December 5, 2023

The venture capital (VC) landscape has always been a playground for risk, driving the economy’s most transformative ideas from conception to reality. As we step into 2024, this ecosystem is poised for another interesting chapter, teeming with potential for a boom or a bust and marked by distinct trends and shifts. What VC Professionals Think […]

Read the full article →

Summing Up the VC Market in Four Charts

November 21, 2023

As we approach the end of a surprisingly resilient year, we think it’s a good idea to look at where we’ve been and where we stand on the venture capital (VC) front. Here’s that look in four charts, according to private equity data provider Pitchbook. Median US VC Seed Pre-Money Valuations The first look below […]

Read the full article →
Real Time Web Analytics