Insiders already know this. The venture capital (VC) industry has been raising some enormous funds in recent years. The question here is: Did we just see the end of an era? As background, private equity and venture capital data provider Pitchbook recently released its accounting of the VC mega-found round activity, and provides a reasonable backdrop for consideration of the question. The look follows.
Overall VC Mega-Round Activity
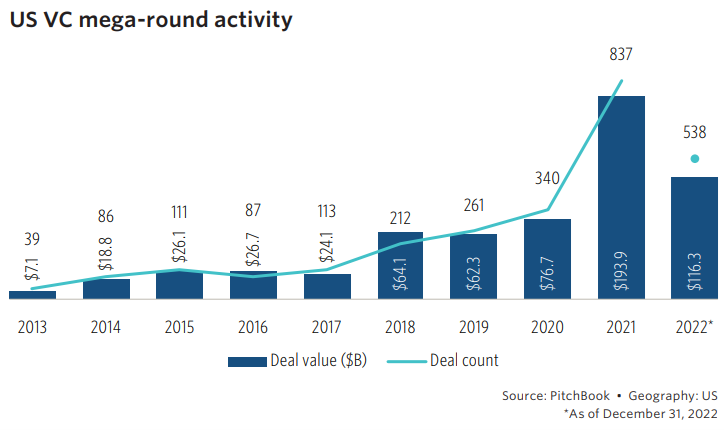
The first look that follows is Pitchbook’s estimate of overall VC mega-round activity since 2013. In 2013, overall deal value for mega-rounds reached $7.1 billion across 39 deals. Action continued to grow through 2014, 2015, 2016, and 2017, reaching a high of $26.7 billion in 2016 for deal value and 113 deals in 2017.
In 2018, activity jumped, with deal value increasing to $64.1 billion across 212 deals. In the two subsequent years, deal value reached $62.3 billion and $76.7 billion, respectively, across 261 and 340 deals.
Then, in 2021 deal activity really boomed. The number of deals exploded to 837, and deal value reached an astonishing value – $193.9 billion.
Going into 2022, some analysts thought we had reached a new era of activity, suggesting that VC mega-round activity would continue growing on top of the 2021 level for the foreseeable future. That view turned out to be a little too optimistic. Overall deal counts declined from 2021 to 2022 to 538 deals and deal value dropped to $116.3 billion. On the whole, the fizzle in 2022 was still quite healthy by historical standards, albeit not at the booming levels of 2021.
The VC Picture Compared with the S&P 500
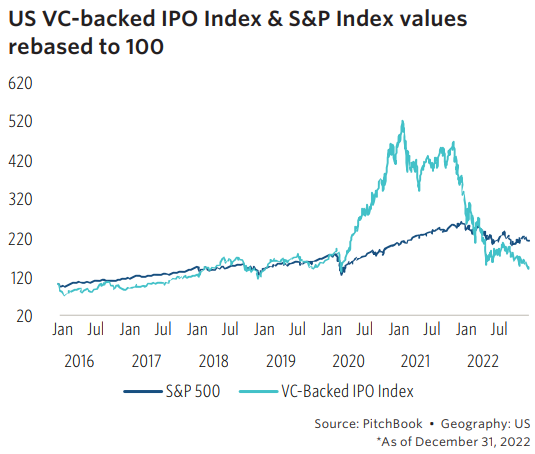
The rise in VC mega-round activity and the subsequent cooling off after the 2021 boom needs some comparison for it to be useful. The following compares a VC-backed IPO Index to the S&P 500 Index. By this measure, it’s easy to see the rise and fall of the beloved investing vehicle of VC. Interestingly, when using 2016 as the baseline, the S&P 500 Index has now performed better over the period than the VC Index.
Looking at the Over $1 Billion Universe
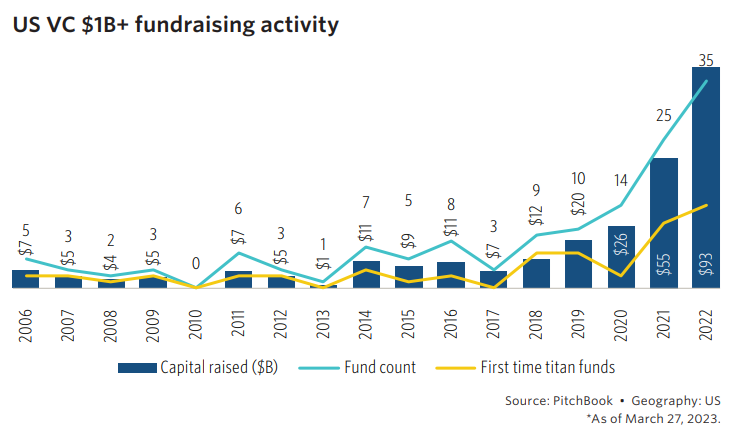
The previous picture includes all VC mega-round activity. When looking at just the activity for $1 billion or more, the rise is incredible. In 2022, fundraising activity for $1 billion and over venture capital activity reached $93 billion across 35 deals, an amazing increase from the 2021 values of $55 billion across 25 deals and the 2020 activity of $26 billion across 14 deals. This annual view for the biggest of big deals doesn’t show any slowdown. Why would one say 2022 ended with a fizzle? Read further.
The Last Quarter of 2022 was the Real Fizzle
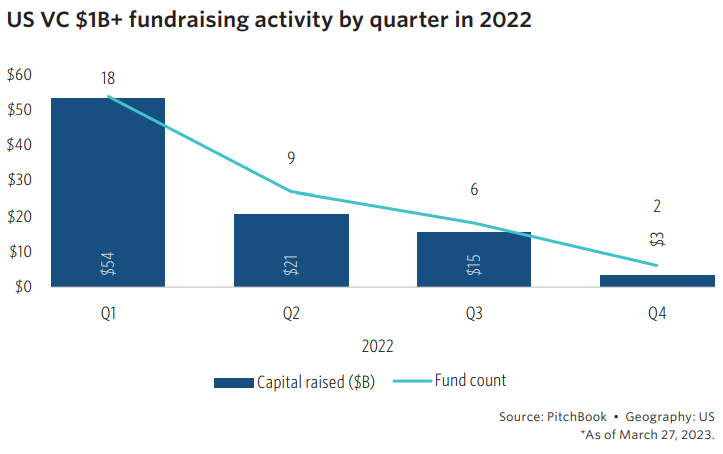
Given the previous view, how did 2022 end with a fizzle? The following graphic has the answer. The number of deals and fundraising amount precipitously slowed from the first quarter of 2022 to the fourth quarter of the year, slowing to a minimal 2 deals for a value of $3 billion by years end. In the first quarter, those measures were 18 deals and $54 billion in value. Hmm.
Summing Up
Overall, VC mega-round activity declined to a fizzle compared to its 2021 heyday. The drop poses the question of whether the coming years will be more subdued for VC activity. The question, of course, depends on how well VC funds perform against competing investment alternatives.

Comments on this entry are closed.