In an interesting read on the venture capital exit world, private equity data provider Pitchbook recently released what is being called “Pitchbook’s VC Exit Predictor.” The idea of predicting exits has long been of interest to venture capital investors and managers. Here’s a review of their latest modeling efforts.
Some Background
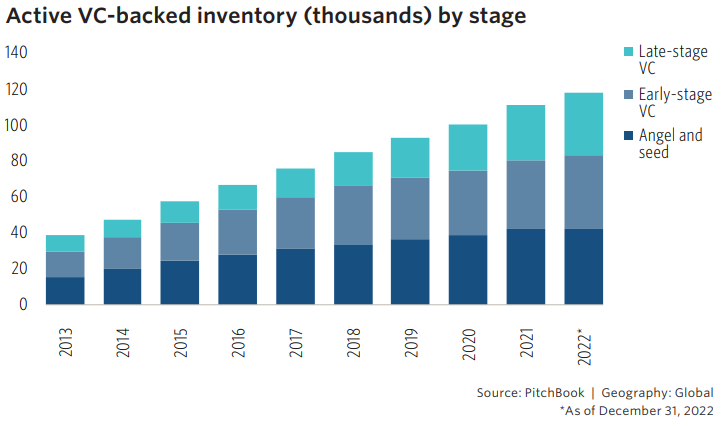
Before delving into Pitchbook’s public information on its VC Exit Predictor, here’s some background. The active VC-backed inventory continues to climb, with the total number of active VC-backed companies in the Pitchbook database up to 120,000 from just 40,000 in 2013. Simply put – the number of potential exits is large and growing.
Pitchbook’s Model
According to Pitchbook, their model is trained on over 64,000 observations of startups with hundreds of individual data points, on average. The model’s exit probabilities stem from a model that is then used to calculate expected return of an investment in the startup’s next round of financing by employing historical returns by series as derived from capitalization table information. The modeling enables Pitchbook to claim that their model-created Opportunity Score produces stage-agnostic ranks for companies.
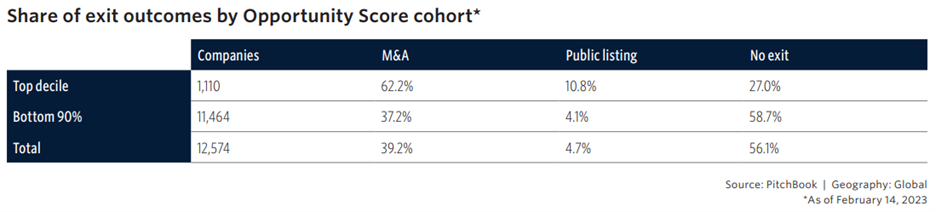
The following table summarizes Pitchbook’s model classification results. Overall, for the top defined decile, encompassing 1,110 companies, 62.2% exited through a merger and acquisition (M&A), 10.8% went through a public listing, and 27.0% had no exit.
By comparison, the bottom 90th of companies encompassed 11,464 companies, with only 37.2% of companies exiting through an M&A, 4.1% exiting through a public listing, and 58.7% not exiting.
For the entire dataset, there were 12,574 observations, of which 39.2% exited with an M&A 4.7% exited through a public listing, and 56.1% did not exit.
Another View – By Stage
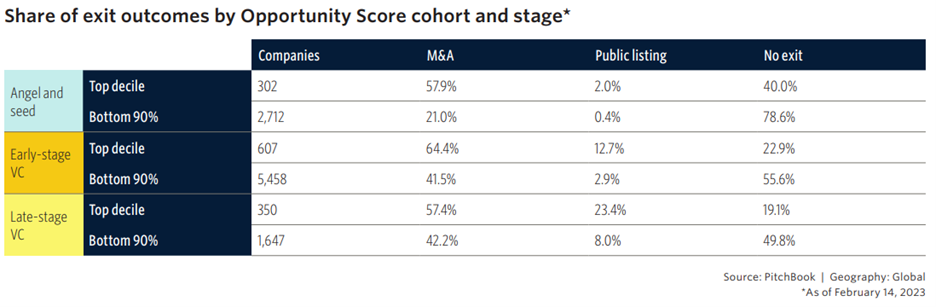
The next view depicts the share of exit outcomes by Pitchbook’s Opportunity Score and stage. Of the three classified stages – Angel and seed, Early-stage VC, and Late-stage VC – the stage with the highest M&A exit for the top decile was Early-stage VC at 64.4%, followed by Angel and seed at 57.9%, and Late-stage VC at 57.4%. For those same three stages, the highest percentage of companies that had an M&A exit among the bottom 90% of companies was Late-stage VC at 42.2%, followed by Early-stage VC at 41.5%, and Angel ad seed at 21.0%.
Shifting attention to the public listing outcomes, the share of companies that had the highest exits via public listing was Late-stage VC, with 23.4% of top decile companies exiting this way and 8.0% of the bottom 90% exiting this way. For Early-stage VC, those figures were 12.7% (top decile) and 2.9% (bottom 90%), respectively. For Angel and seed companies, the results were 2.0% (top decile) and 0.4% (bottom 90%), respectively.
Lastly, shifting to the share of companies that had no exit, for Angel and seed companies, 40.0% of the top decile had no exit and 78.6% of the bottom 90% had no exit. The same figures for Early-stage VC were 22.9% (top decile) and 55.6% (bottom 90%), respectively. For Late-stage VC, the figures were 19.1% (top decile) and 49.8% (bottom 90%), respectively.
Summing Up
Overall, Pitchbook’s new model for predicting VC exits is an interesting take. Whether it will be able to predict the coming years’ exits, of course, is where we’ll see if the model carries weight.

Comments on this entry are closed.