Of all the financial information released this past week around the world, perhaps the most important was the state of the U.S. labor market. Although still growing, the picture is getting weaker. Here’s a view of the American labor market in five charts.
Labor Force Participation Rate
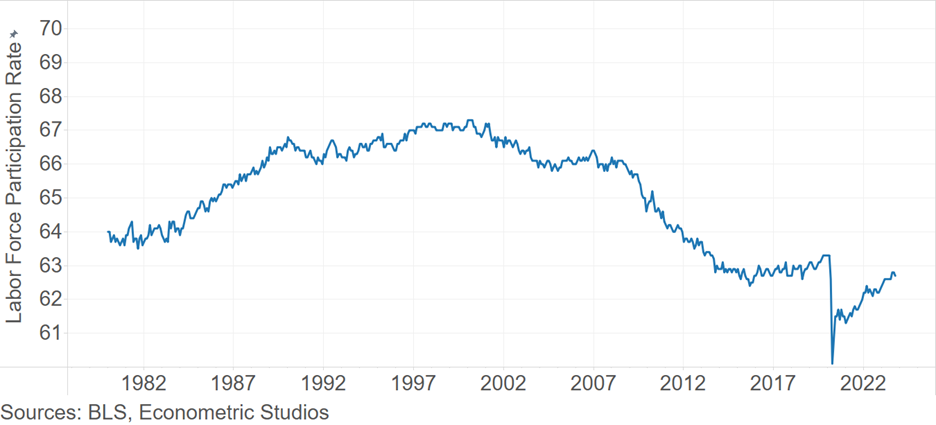
The first view is the U.S. Labor Force Participation Rate (LFPR). The LFPR ticked down in October, to 62.7% from 62.8%. Interestingly, interest in working is still below its pre-pandemic peak of 63.3% and well below its all-time peak of 67.3% in early 2000.
For some reason, there’s less interest in working. Demographic shifts explain part of the downward drift. Lackluster job prospects certainly explains part of the drift, but certainly there’s something deeper going on here.
Job Growth is Still Strong
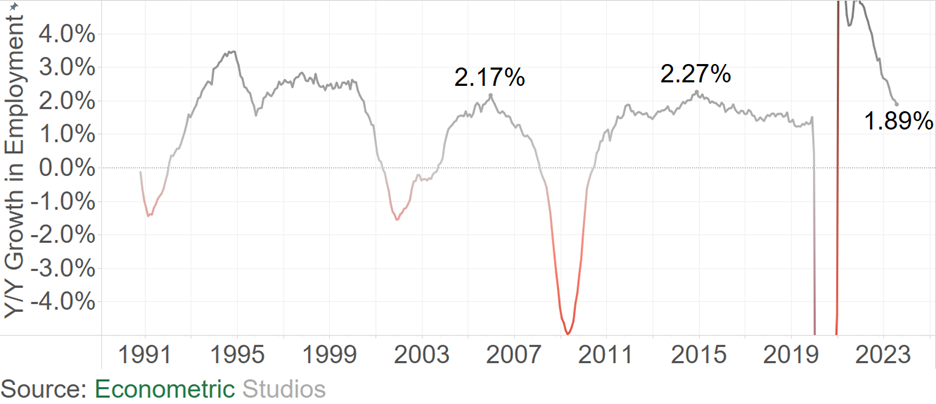
The second picture of the American jobs market is year-over-year growth in jobs. Job growth, at 1.9% year-over-year, is still healthy and growing faster than population growth (1.4%). With that said, growth is coming down quickly. Of course, a bullish take on the jobs market might suggest that at the current pace of deceleration, the American economy is more than 18 months from job losses. Healthy, very healthy.
The Unemployment Rate Continues to Rise
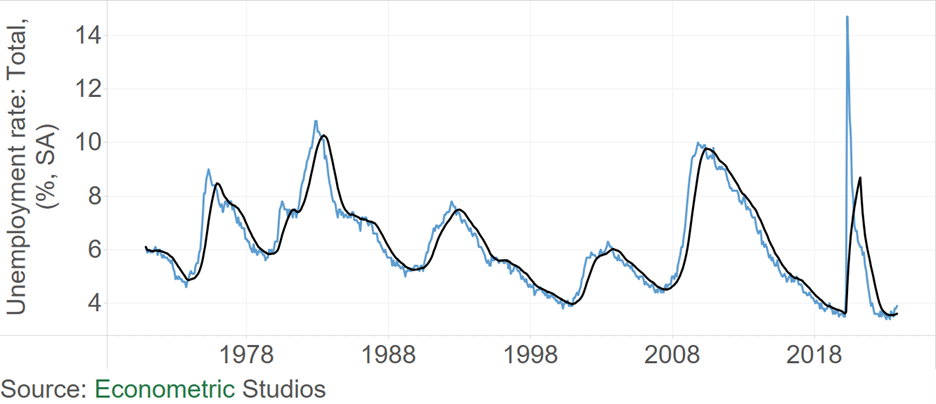
The third view is the Unemployment Rate and its 12-month moving average. As an ominous sign, the actual unemployment rate has been floating above its 12-month moving average since August. This typically occurs just prior to a recession signal. Just a word of caution.
The Older Generation Continues to Be a Force in the Labor Force
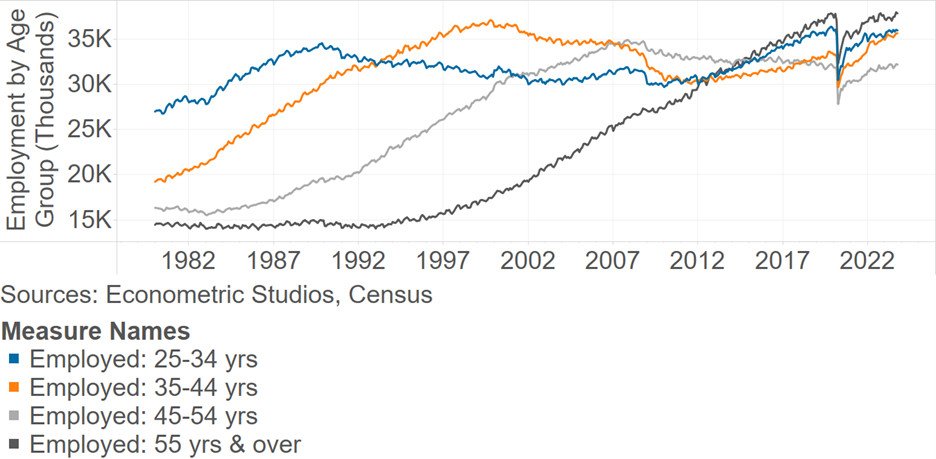
The fourth view is employment by age group. Before looking, of these age groups, which do you think would be the largest demographic in the labor force: 25 to 34, 35-44, 45-54, or 55 and over?
Fascinatingly, and this is only recently, the largest demographic group in the labor force are individuals aged 55 and over at around 38 million. Not far behind in second place are the 25 to 34 year olds at 35.9 million. Third place are the 35 to 44 year olds at 35.6 million. And rounding out the demographic groups are the 45 to 54 year olds at about 32 million.
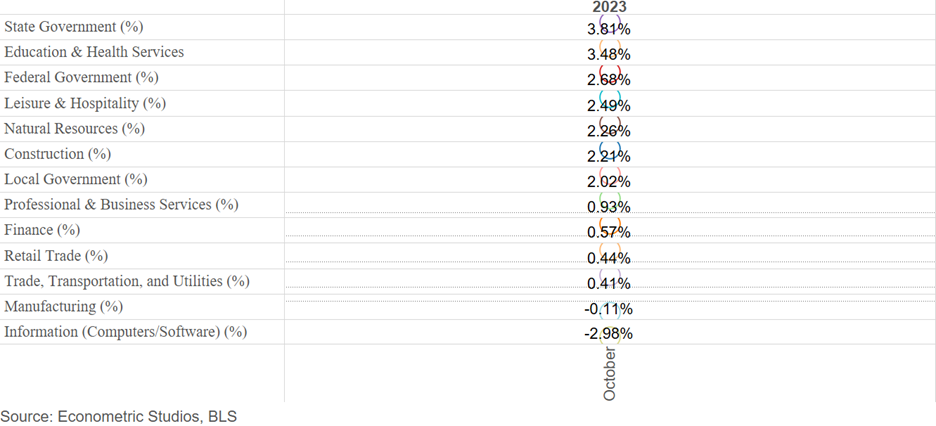
By Industry
The fifth view is by industry. Interestingly, although somewhat sad, the fastest growing sector in 2023 has been State Government at 3.81%. Not far behind have been Education & Health Services at 3.48% and Federal Government at 2.68%.
On the other end, the Information sector continues to lose jobs (-2.98%) as does the Manufacturing sector (-0.11%).
Summing Up
Overall, the American labor market continue to chug along, albeit at a slower pace that suggests hiring is slowing significantly. Whether this indicates a pending recession is yet to be seen (of course), but the direction is heading towards such a situation.

Comments on this entry are closed.