If one were to ask you – How top heavy is the U.S. venture capital (VC) market? Do you think 20% of the firms garner 80% of the fundraising money? Is it more like 60/40? Here’s a look, based on updated 2024 figures out of private equity data provider Pitchbook.
The Broad Picture
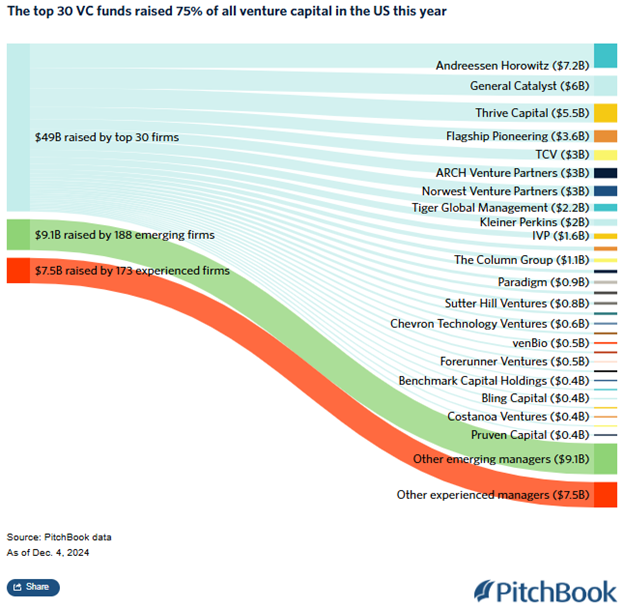
The view of the fundraising picture in the U.S. VC market is perhaps best captured in the following Sankey graph. In 2024, the U.S. VC landscape saw concentrated among a select group of firms, with Andreessen Horowitz (a16z) emerging as a dominant player. Does this trend underscore the growing influence of established VC firms and presents challenges for emerging managers seeking capital?
Dominance of Top VC Firms
As shown, data from 2024 reveals that nine venture capital firms accounted for approximately 50% of all funds raised by U.S. investors. Of note, Andreessen Horowitz secured 11% of the total venture dollars raised, while General Catalyst captured 9.1%, and Thrive Capital garnered 8.4%.
Andreessen Horowitz’s Fundraising Milestones
In May 2024, Andreessen Horowitz announced the successful raising of $7.2 billion across five distinct fund strategies, including American Dynamism ($600 million), Apps ($1 billion), Games ($600 million), Infrastructure ($1.25 billion), and Growth ($3.75 billion). Unbeknownst to no insider, this capital influx highlights the firm’s expansive reach and its commitment to diverse investment areas.
Implications for Emerging VC Managers
The concentration of capital among top firms poses challenges for emerging VC managers. In the first half of 2024, U.S. venture firms raised $37.4 billion, marking a slower pace compared to previous years. Macroeconomic factors and a tepid market for initial public offerings (IPOs) and mergers have contributed to a cautious approach among limited partners. Consequently, emerging managers face heightened pressure due to a lack of proven returns, possibly making fundraising (claims) more arduous.
Investor Enthusiasm for AI and Technology
Despite the overall slowdown, sectors like artificial intelligence (AI) have continued to attract a lot of interest. For instance, in December 2024, Databricks, a data analytics and AI company, was on the verge of securing nearly $9.5 billion in one of the largest VC funding rounds to date. Leading this round were Thrive Capital, Andreessen Horowitz, Insight Partners, and Singapore’s sovereign wealth fund GIC. This deal underscores investors’ enthusiasm for high-quality tech firms and the substantial venture capital available for AI-driven companies.
Summing Up
The U.S. venture capital fundraising landscape in 2024 is, perhaps unsurprisingly, concentrated among a few dominant firms, with Andreessen Horowitz playing a pivotal role. While this trend reflects the growing influence of established VC entities, it also presents challenges for emerging managers striving to secure capital. Nonetheless, investor interest in sectors like AI remains robust, indicating a continued appetite for innovation and technological advancement.
{ Comments on this entry are closed }